Wind profile
Choose Tools → Wind profile.
The window opens when the file has wind at more than one height. aermet_ORG.sfc is a surface file with a single level, so this command tells you to open a file with wind at more than one height. Download aermet_ORG.pfl and open that profile, or use another AERMOD profile (.pfl), an FSL radiosonde, or a CSV that includes a height column with more than one level.
The profile keeps every level. It uses the date range, the ticked hours, the direction correction, and the stability ticks. It does not follow the single height selected on the quick bar, and it does not follow the By height period. Direction remains the direction the wind is blowing from.
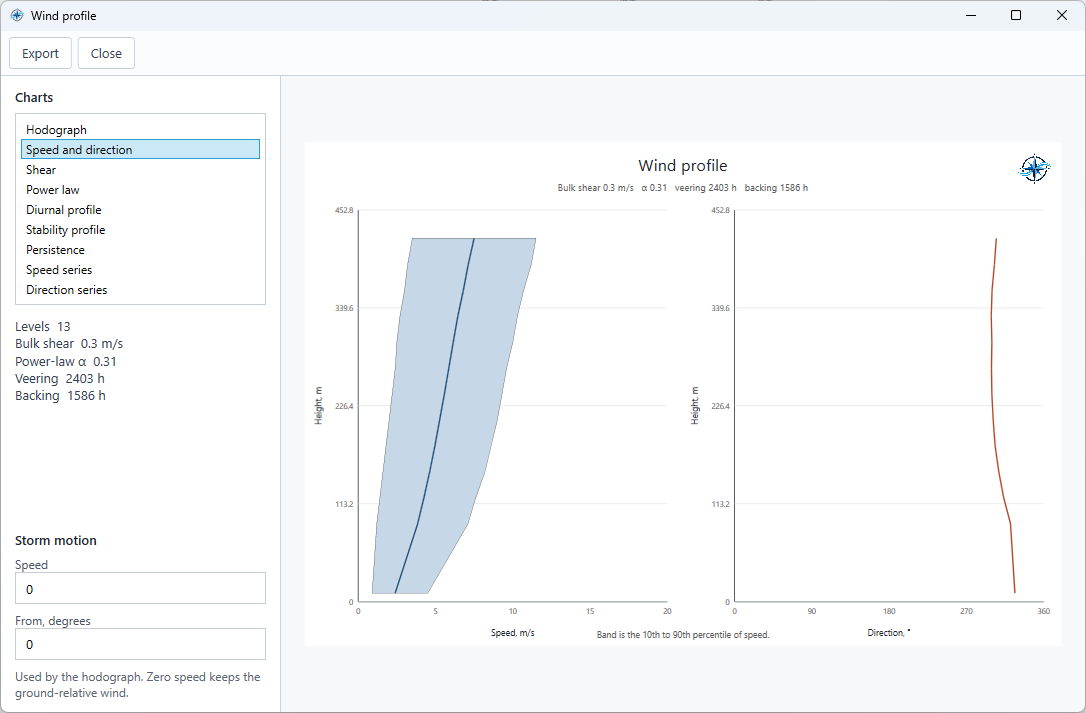
Figure. Speed and direction for a file with 13 levels. Storm motion is 0, so this chart is the ground-relative wind. Storm motion changes the hodograph only.
Charts
Select a chart in the list. The mouse wheel zooms it.
- Hodograph plots the mean wind at each height. Storm motion changes this chart. Enter a speed and the direction that motion comes from. A speed of zero keeps the ground-relative wind.
- Speed and direction shows how the mean speed and the mean direction change with height.
- Shear shows the speed change per 100 m and the turning of direction between neighbouring levels. This is distinct from the bulk shear reported beneath the chart list.
- Power law displays two panels side by side. The left panel shows the power-law exponent between neighbouring heights. The right panel shows wind power density against height, in W/m², using an air density of 1.225 kg/m³. Wind speeds are converted to m/s before cubing, irrespective of the plot unit.
- Diurnal profile shows the mean speed by hour and by height.
- Stability profile shows the mean speed by stability class and by height, when the file has classes.
- Persistence shows the magnitude of the mean wind vector divided by the mean scalar wind speed at each height. This dimensionless ratio ranges from 0 to 1. A value near 1 indicates consistent direction; a value near 0 indicates that directions largely cancel. If mean scalar speed is zero, the reported ratio is 0. Changes in speed alone do not reduce the ratio when direction remains fixed.
- Speed series and Direction series show the record through time at each height.
The panel under the list reports:
- Levels, how many heights were found.
- Bulk shear, the magnitude of the difference between mean wind vectors at the lowest and highest levels, in the plot unit. Each mean vector is formed by averaging the east and north wind components at its level. The result is not divided by the height difference.
- Power-law α, the exponent fitted across those levels.
- Veering and Backing, counts of matched observations at the lowest and highest levels where the wind-from direction turns clockwise or anticlockwise, respectively, with increasing height. The turn is normalised to −180° to +180°. Zero turns and times missing at either level are not counted. These counts do not sum the neighbouring-level turns in the Shear chart.
Export writes wind_profile.csv for the levels in view. Close returns to the main window.
Insight adds these charts to the PDF when the open file has two or more heights. On those PDF pages the storm-motion speed is zero.