Wind rose visualisation
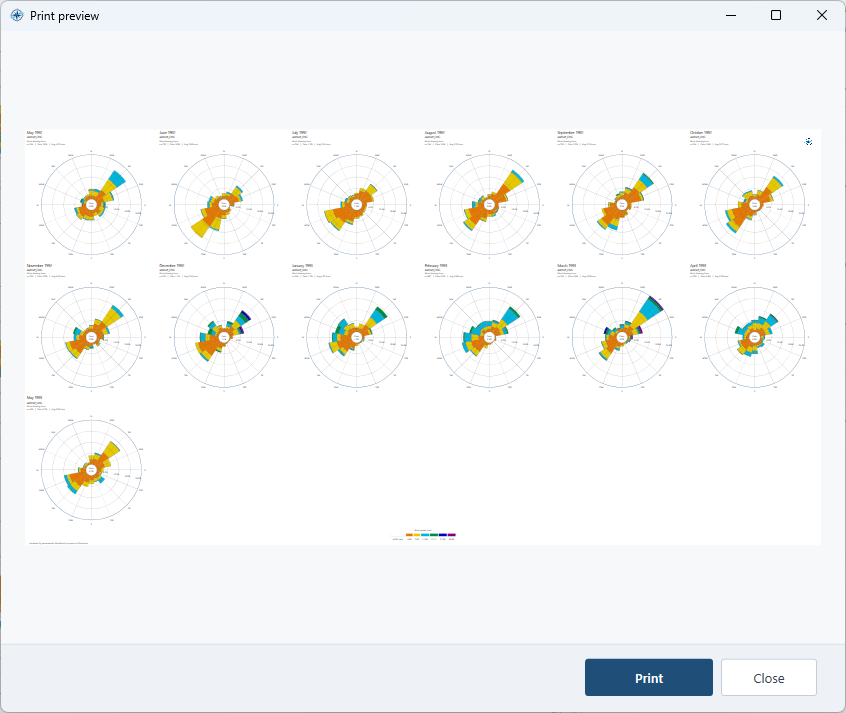
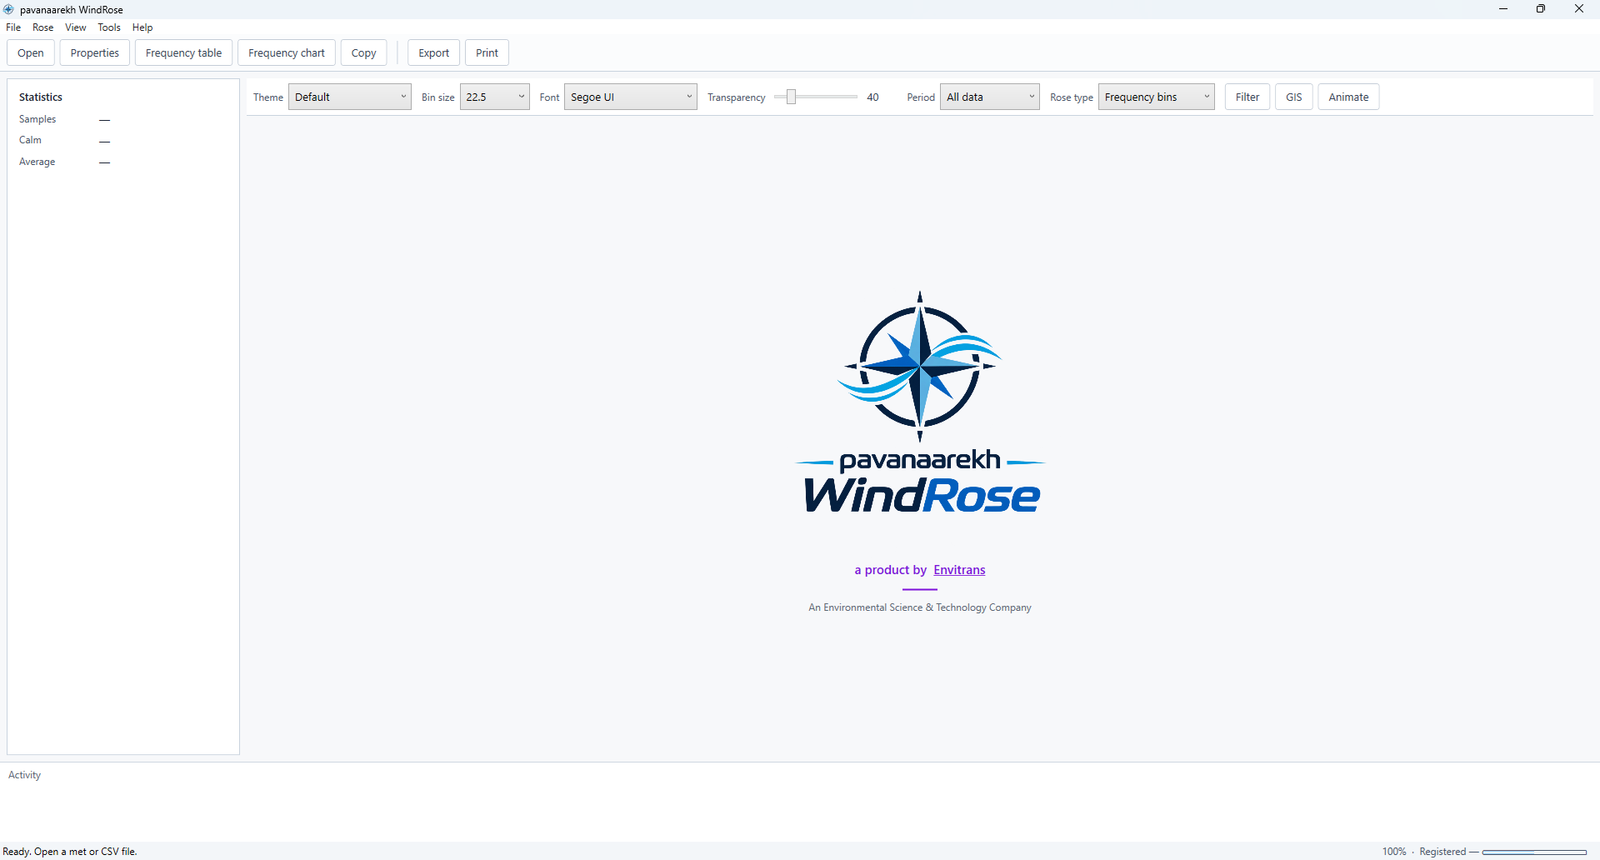
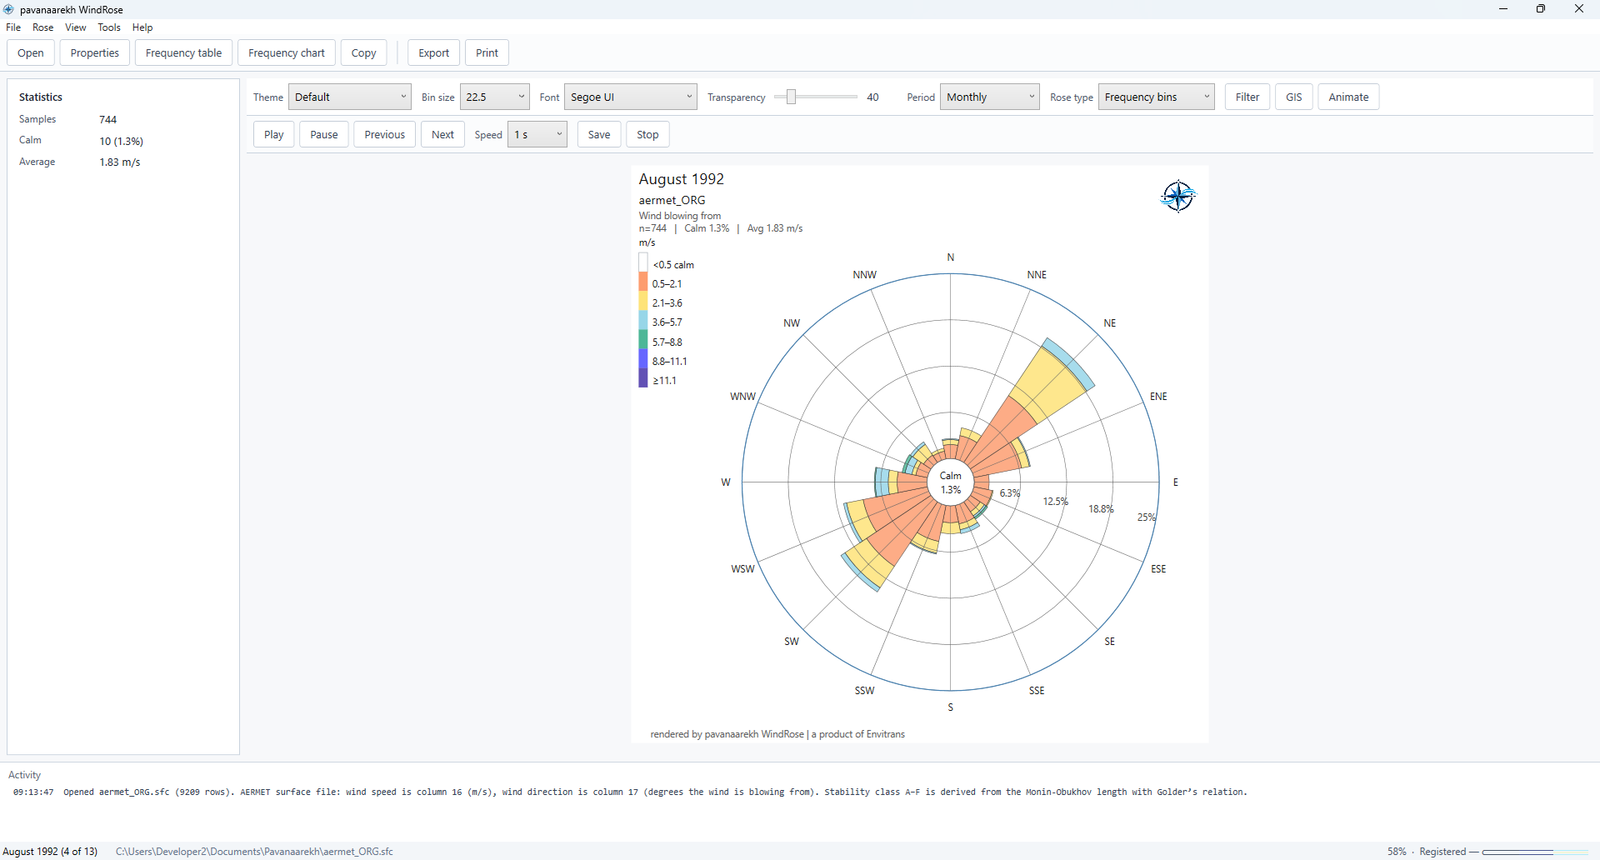
Plot wind direction and speed as frequency bins, speed lines or speed dots. Set direction sectors, speed classes, colours and themes, and compare monthly, seasonal, annual, diurnal or stability-based roses. View sample count, calm share and mean speed.
Frequency table and chart
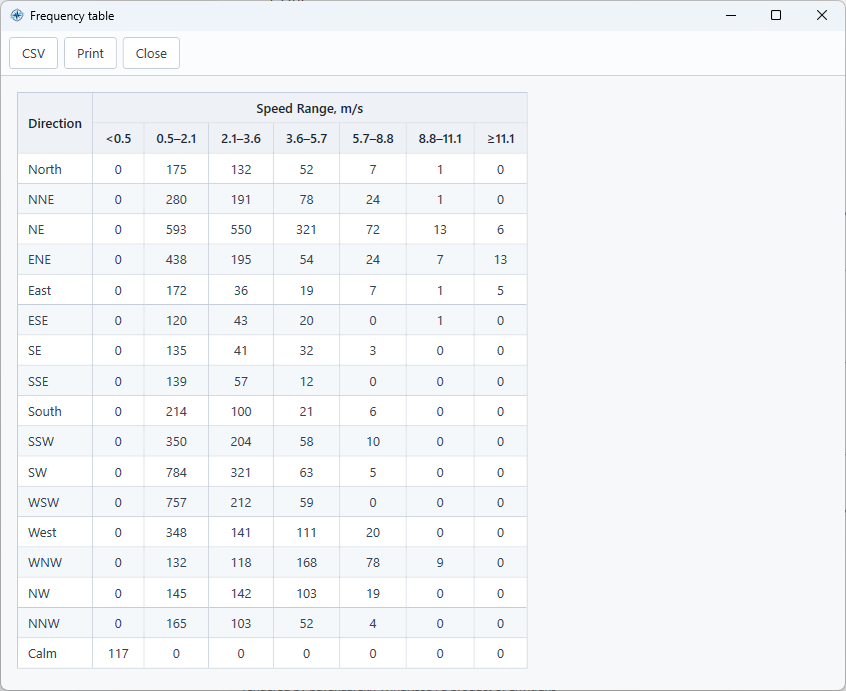
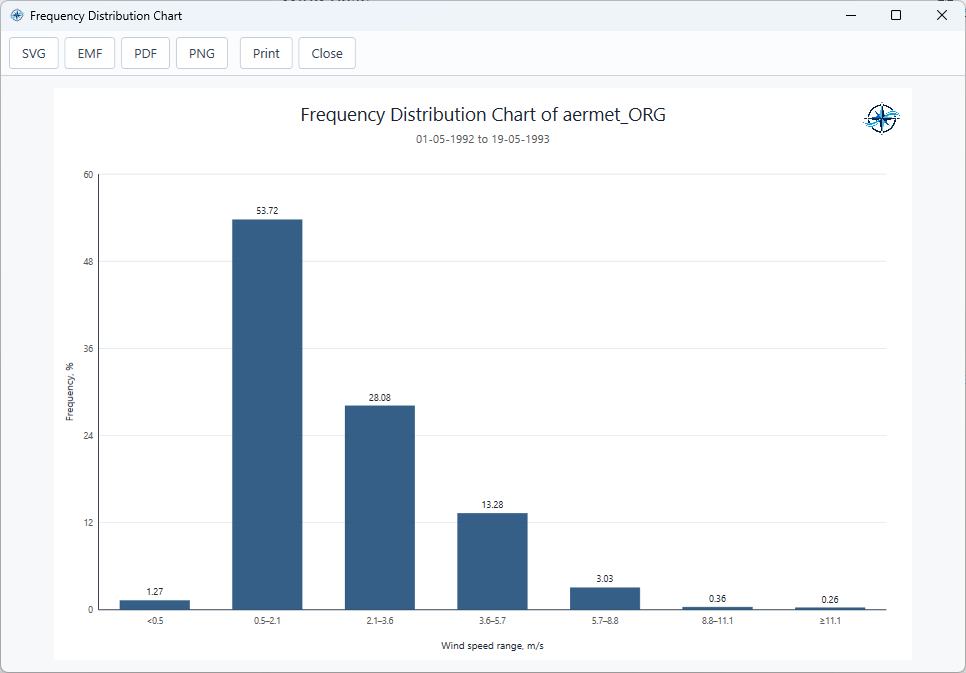
Inspect wind speed classes in a direction-by-speed frequency table and a percentage distribution chart. Both use the current date, hour and stability filters. Export the table as CSV or save the chart as an image or PDF.
Copy, print and export
Copy a wind rose to the clipboard, print it or export graphics as SVG, EMF, PDF, PNG and other image formats. Export georeferenced roses for mapping in KML, KMZ or shapefile formats, or place a background image behind the plot.
Wind energy estimation
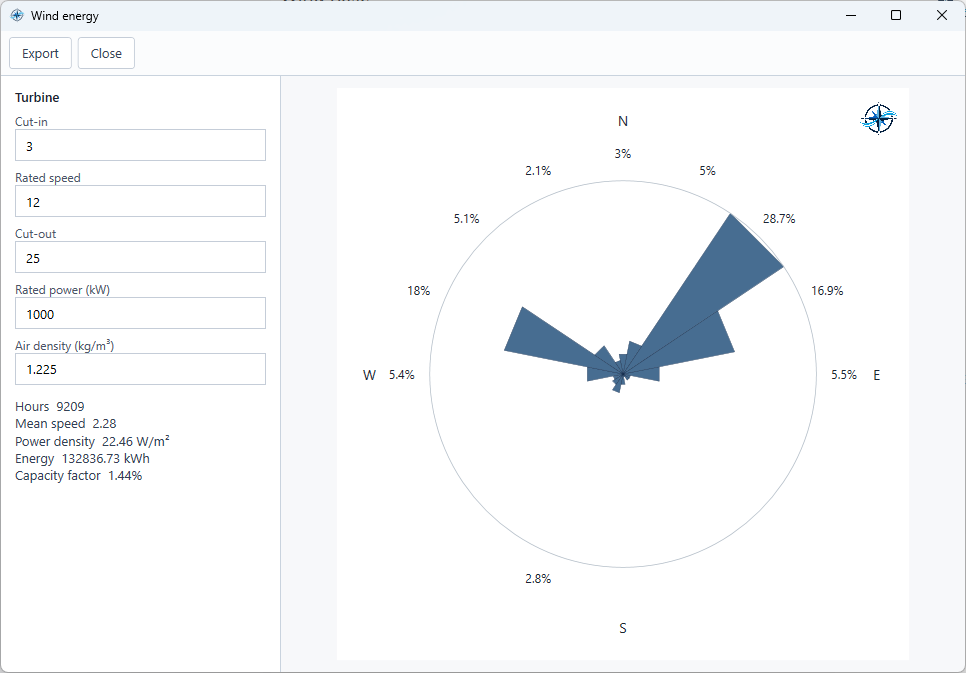
Estimate hourly turbine energy, total energy, capacity factor and wind power density using the selected observations. Adjust cut-in, rated and cut-out speeds and rated power, and view the directional contribution in an energy rose. Turbine speed settings use the selected plot unit.
Wind profile analysis
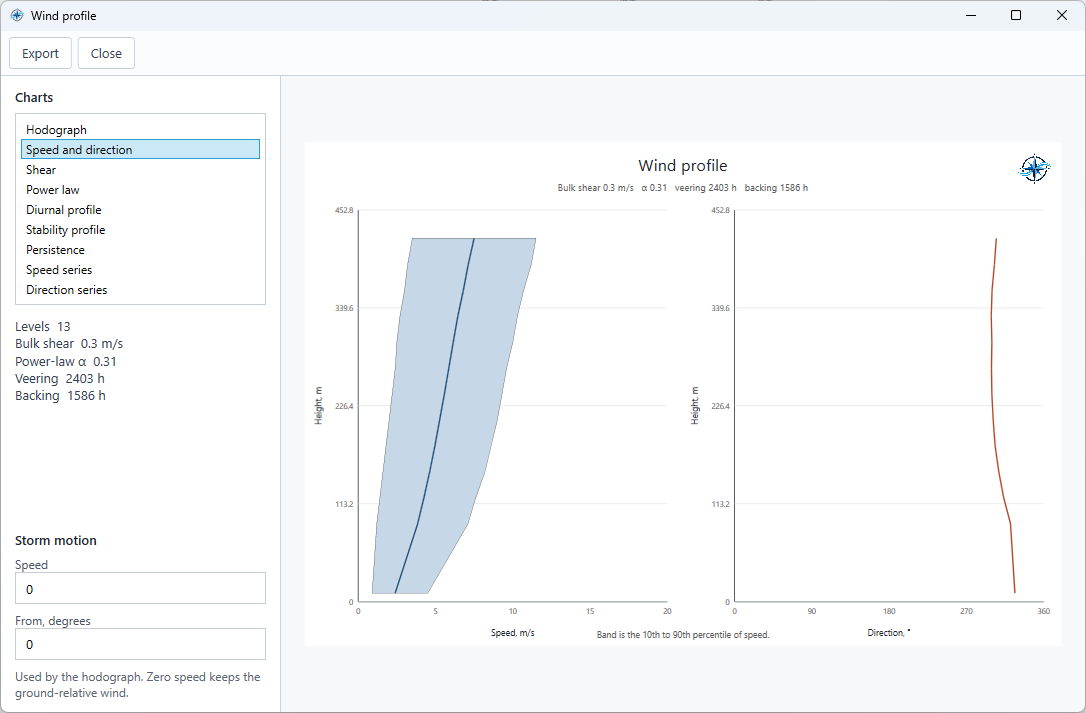
Analyse observations recorded at multiple heights using hodographs, speed and direction profiles, shear, power-law and power-density plots, diurnal and stability profiles, persistence, and time series.
Wind rose animation
Play a sequence of roses across months, seasons, years, day and night, stability classes or measurement heights, where the data supports multiple plots. Control playback and save the sequence as GIF, AVI or MP4.
WindRose Insight PDF
Generate a PDF report containing the data summary, current wind roses, frequency table and chart, and wind energy estimate. When observations cover multiple heights, wind-profile charts are included as well.
Convert observations to CSV
Export the filtered observation records to a CSV table with date, hour, wind direction, wind speed, unit and available height and stability information for use in other applications.