Properties
Choose Properties on the command bar, or Rose → Properties. Filter and GIS on the quick bar open this window on that tab. Apply redraws the rose with the values in the window. Cancel leaves the rose as it was.
File → Reset to default restores the plot options. The station name returns to the file name, and the footer returns to rendered by pavanaarekh WindRose | a product of Envitrans.
General
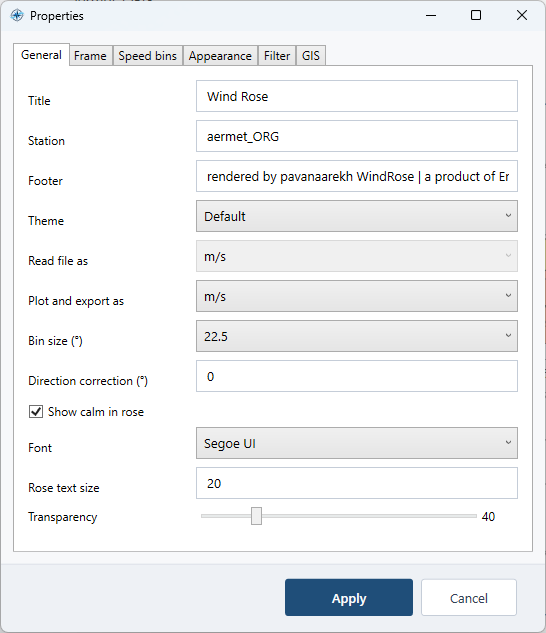
Figure. General holds the title, the station, the units, and the type size.
- Title starts as
Wind Rose. - Station starts as the file name without its extension. For the sample, that is
aermet_ORG. The frequency chart uses this name in its title. - Footer is the line under the rose.
- Theme is the same list as the quick bar.
- Read file as is the unit of the numbers in the file. For
aermet_ORG.sfc, leave this on m/s. The choices are m/s, mph, fps, km/h, and knot. - Plot and export as is the unit of the rose, the color scale, the speed bins, the table, and the chart. Changing it converts the bin limits into the new unit and reloads the file.
- Bin size (°) matches the quick bar.
- Direction correction (°) is added to the direction the wind is blowing from. Positive is clockwise.
- Show calm in rose draws the center ring.
- Font is the typeface of the rose. The quick bar has the same list.
- Rose text size is one size for the compass, the ring percents, the color scale, calm, the statistics line, the unit, and the footer. The station is 1.25 times that size. The title is 1.6 times that size. The allowed range is 12 to 32. The start value is 20.
- Transparency matches the quick bar. The number beside the slider is the current value.
Frame
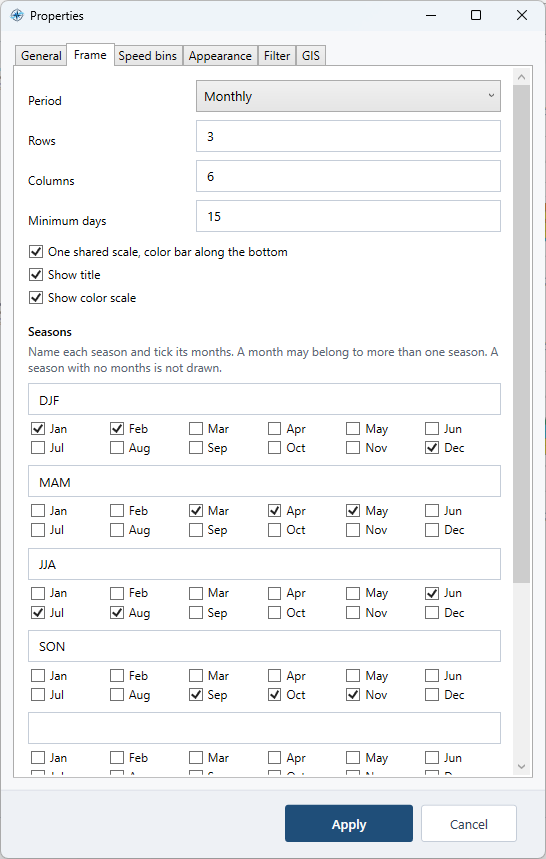
Figure. Frame sets the period, the grid, and which hours count as day.
- Period matches the quick bar: All data, Monthly, Seasonal, Annual, Diurnal, By height, or By stability.
- Rows and Columns are the grid. Columns stay as typed, from 1 to 6, and shrink when there are fewer roses. Rows become whatever those columns need, up to 6.
- Minimum days applies to monthly, seasonal, and day-and-night roses. The range is 1 to 31, and the starting value is 15. Each rose needs at least Minimum days × 24 observations (360 by default). For Diurnal plots, Day and Night are checked separately; with the starting 12-hour groups and complete hourly observations, each needs 30 calendar days of data.
- One shared scale, color bar along the bottom gives every rose the same outer percent and one shared color bar.
- Show title and Show color scale turn those parts of the drawing on.
Seasons. Up to six seasons. Each has a name and a set of months. A month may belong to more than one season. A season with no months is left undrawn. The start set is DJF (December, January, February), MAM (March, April, May), JJA (June, July, August), and SON (September, October, November).
Day hours. Ticked hours are day. Every other hour is night. The start ticks are 06 through 17. These hours are used when the period is Diurnal.
Speed bins
The seven boxes R1 through R7 are the speed-class limits, in the plot unit. For metres per second they start at:
| Limit | m/s |
|---|---|
| R1 | 0.5 |
| R2 | 2.1 |
| R3 | 3.6 |
| R4 | 5.7 |
| R5 | 8.8 |
| R6 | 11.1 |
| R7 | 25 |
Each speed class includes its start and stops before its end. With the starting limits, calm is every hour below 0.5 m/s. An hour of 0.5 m/s is in 0.5–2.1. An hour of 2.1 m/s is in 2.1–3.6, and the same step applies at 3.6, 5.7, and 8.8. The last class is every hour from 11.1 m/s upward, labeled ≥11.1, so an hour of 25 m/s stays in that class. The rose, the frequency table, and the frequency chart use these same labels. Calm is counted once, on the Calm row, in the first speed column. That column is 0 on North, NNE, and the other directions. The chart’s first bar is those same hours.
Fix upper limit is off until you tick it. R7 stays at 25 and is unused while the box is clear. Tick it to split the last class at R7: 11.1–25, which includes 11.1 and stops before 25, and ≥25, which keeps every faster hour. The note under the boxes names the plot unit and the unit the file is read in.
When you change Plot and export as, these numbers are converted so the physical limits stay the same.
Appearance
- Rose type is Frequency bins, Speed lines, or Speed dots. The quick bar has the same list.
- Spoke spacing (°) is how often a direction line is drawn: 10, 15, 22.5, 30, 45, or 90.
- Direction spokes and Scale rings turn those lines on.
- Colors are buttons for the calm class, each speed class through the class from R6 upward, the rings, the outline, and the text. While Fix upper limit is ticked, a further button colors the class from R7 upward. Choose a button to open the color dialog.
Frequency bins draw one arm per direction. Speed lines and speed dots plot every hour by the direction the wind is blowing from, and their ring labels are wind speed.
Filter
The date range here is the range of the rose, the frequency table, and the frequency chart.
- All data uses the start and end of the file. Opening another file leaves the saved from-and-to dates unchanged.
- Filter by date range uses From and To. If the end falls before the start, the two dates are swapped. Opening a file while All data is off sets From and To to that file’s first and last dates.
- Include only the hours ticked below keeps the hours whose boxes are ticked. Hours are 0 through 23.
- Stability class A through F starts with every class ticked. A file with no class uses every observation. Clear a class to leave those hours out. When the period is By stability, the roses are one per class that has hours, and these ticks are set aside.
aermet_ORG.sfc carries a derived class on hours where the Monin–Obukhov length can be read, so these ticks apply to that file.
GIS
Latitude, Longitude, and Rose radius (m) place the rose when you export KML, KMZ, or a shapefile. The radius starts at 2000 metres. Leave latitude and longitude blank to export the geometry at 0, 0. The status bar says so after that export.
For the sample station, type latitude 40.790 and longitude -75.140. West is a negative longitude.