Wind energy
Choose Tools → Wind energy. The window uses the same hours as the rose: the date range, the ticked hours, and the stability classes, in the plot unit. The direction of each hour is the direction the wind is blowing from, after any direction correction.
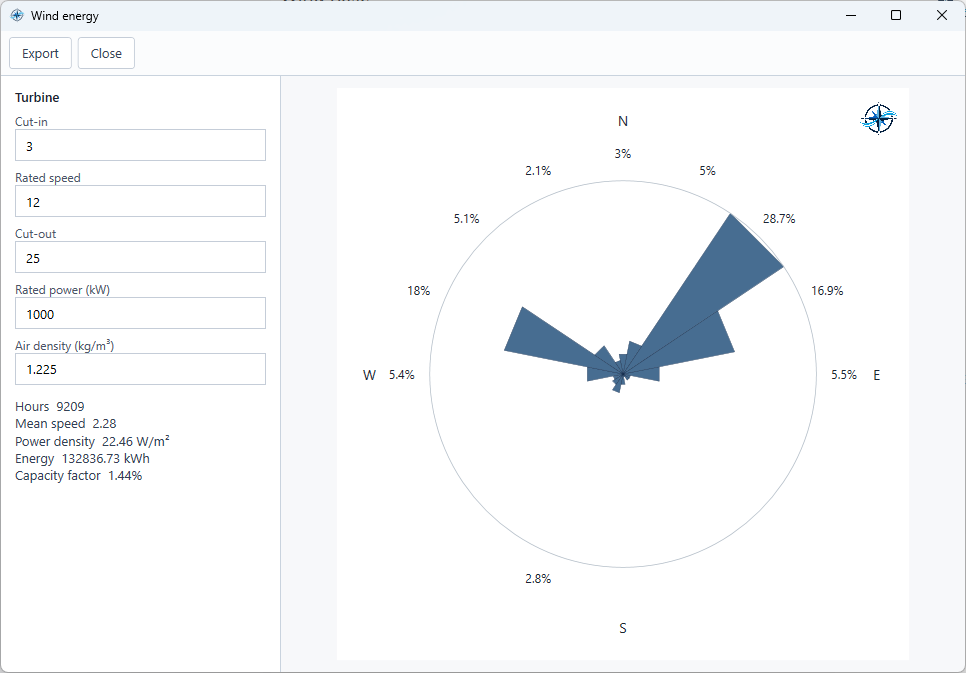
Figure. Energy from the hours in aermet_ORG.sfc, with the starting turbine.
The turbine starts as:
| Field | Start value |
|---|---|
| Cut-in | 3 |
| Rated speed | 12 |
| Cut-out | 25 |
| Rated power | 1000 kW |
| Air density | 1.225 kg/m³ |
Cut-in, rated speed, and cut-out are interpreted in the selected plot unit. Their starting values (3, 12, and 25) are not converted when you change units. To retain the same physical turbine, enter equivalent speed thresholds in the new plot unit. For the sample, the plot unit is m/s. Click another field, or leave the one you edited, to recalculate.
Power for one hour is:
- Zero when the speed is below cut-in or above cut-out.
- The rated power when the speed is at or above the rated speed and still at or below cut-out.
- Between cut-in and rated speed, power follows cubic interpolation:
$$P(v)=P_r\frac{v^3-v_c^3}{v_r^3-v_c^3}$$
Here, $v$ is wind speed, $v_c$ is cut-in speed, $v_r$ is rated speed, and $P_r$ is rated power. At cut-in, power is zero; at rated speed, it reaches rated power. If rated speed is not above cut-in, the cubic step is skipped and speeds from cut-in through cut-out receive rated power.
The panel then shows:
- Hours, the number of observations in the current range.
- Mean speed.
- Power density, in W/m², calculated as $\tfrac12\rho\,\overline{v^3}$, using wind speeds converted to m/s and the specified air density in kg/m³. It is independent of the selected plot unit.
- Energy, in kWh, the sum of the hourly power.
- Capacity factor, that energy divided by rated power times the number of hours, as a percent.
Air density changes only power density; it does not change energy, capacity factor, or the directional energy rose. Because turbine speed thresholds remain numerical values in the plot unit, changing the plot unit without adjusting those thresholds can change the calculated energy and capacity factor.
The drawing is an energy rose. Each arm is one direction bin, the same bin size as the wind rose. The arm length is that direction’s share of the energy, scaled to the strongest direction. A direction that holds at least 2% of the energy is labeled with that percent.
Export writes wind_energy.csv with the hours, mean speed, power density, energy, capacity factor, and each sector’s share of the energy. Close returns to the main window. The mouse wheel zooms the energy rose.
Insight uses the starting turbine on every run: cut-in 3, rated speed 12, cut-out 25, rated power 1000 kW, and air density 1.225 kg/m³. Its turbine speed thresholds are also interpreted in the selected plot unit, without automatic conversion. Numbers you type in this window apply to this window and to the CSV it exports, not to subsequent Insight runs.