Frequency table and chart
Both use the same hours as the rose: the date range, the ticked hours, and the stability classes. Open aermet_ORG.sfc first. If no file is open, the application asks you to open a data file.
Frequency table
Choose Frequency table on the command bar, or Rose → Frequency table.
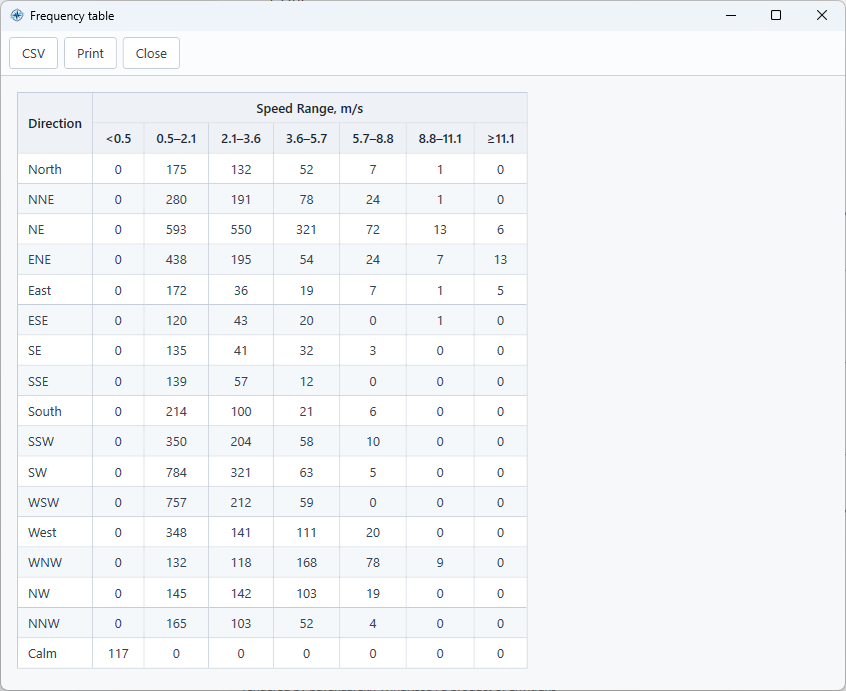
Figure. Frequency table for aermet_ORG, with the plot unit set to knot. The Calm row holds every hour below the first limit. Each direction row leaves that column at 0.
The first column is Direction. The remaining columns sit under one heading, Speed Range, followed by the plot unit. For the sample, with the starting limits in m/s, the columns run:
- below 0.5
- 0.5–2.1, which includes an hour of exactly 0.5
- 2.1–3.6
- 3.6–5.7
- 5.7–8.8
- 8.8–11.1
- ≥11.1, which includes an hour of exactly 11.1 and every faster hour
With a bin size of 22.5° the direction names are North, NNE, NE, and so on around to NNW. A cell in a direction row is the number of hours from that direction in that speed class. The number on the left of a column is included. The number on the right belongs to the next column. Hours below 0.5 m/s are the exception: each of those hours is calm, and it is counted once, on the Calm row, in the first speed column. It is left out of every direction row, so North through NNW show 0 in that column. An hour of 0.5 m/s is in the column 0.5–2.1, on its direction row. An hour of 2.1 m/s is in the next column. An hour of 11.1 m/s, and an hour of 25 m/s, are both in ≥11.1. The Calm count is the same number as Calm in Statistics. The Calm row shows 0 in every column after the first. The columns, including Calm, add up to the sample count. Tick Fix upper limit on the Speed bins tab to split the last column into 11.1–25 and ≥25.
The table sizes to its cells. Scroll the window if the screen is smaller than the table.
CSV saves the table as frequency-table.csv. Print sends the table to the printer you choose. Close returns to the rose.
Frequency chart
Choose Frequency chart on the command bar, or Rose → Frequency chart.
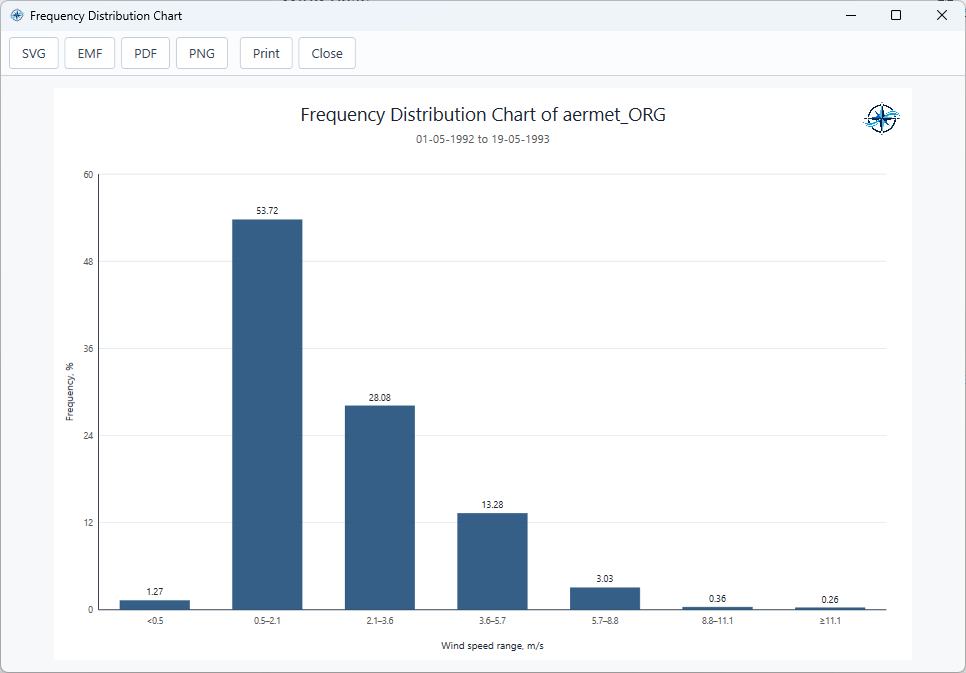
Figure. Frequency chart of aermet_ORG for 01/05/1992 to 19/05/1993. Each bar is one speed class.
The chart is a bar for each speed class, with the same labels as the table. The bar’s height is the percent of hours in that class. The first bar is every hour below 0.5 m/s, the same hours as the Calm row of the table. The chart has no separate Calm row. An hour of 0.5 m/s is in the next bar, and an hour equal to any later limit is in the bar that starts with that limit. The last bar is every hour from 11.1 m/s upward. With Fix upper limit ticked, that bar stops before 25 m/s and a further bar holds 25 m/s and faster. Each hour is counted in one bar. The title is Frequency Distribution Chart of the station name. For the sample, that is aermet_ORG. Under the title, the dates run from the start of the range to the end, as day/month/year.
The mouse wheel zooms the chart.
SVG, EMF, PDF, and PNG each save the chart in that format. Print prints the chart. Close returns to the rose.