The main window
The main window is arranged in five horizontal strips: the Menu bar, Command bar, central workspace, Activity, and Status bar. The central workspace contains Statistics on the left, with the Quick bar above the Plot on the right. Before a file is open, the plot shows the pavanaarekh WindRose mark.
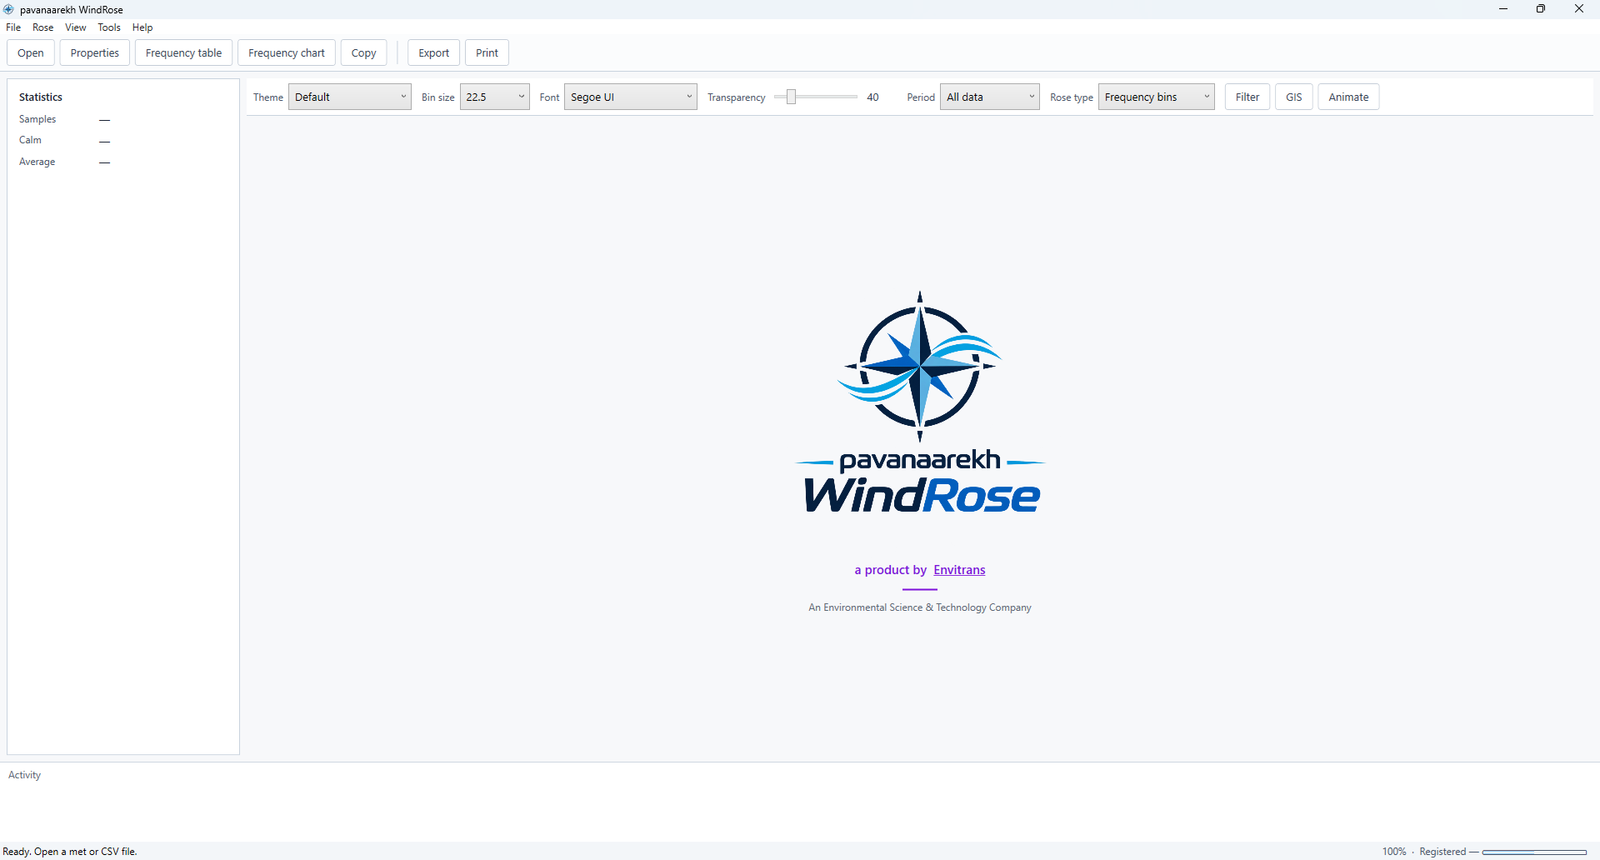
Figure. Statistics are empty, and the status line reads “Ready. Open a met or CSV file.”
Menu bar. File, Rose, View, Tools, and Help.
Command bar. The everyday actions: Open, Properties, Frequency table, Frequency chart, Copy, Export, and Print. Export on this bar is the rose: Graph, transparent PNG, and GIS.
Statistics. On the left:
- Samples is the number of hours in the current rose.
- Calm is the number of those hours below the first speed limit. A speed equal to that limit is counted in the first speed class.
- Average is the mean speed of those hours, in the plot unit.
- Height appears when the file carries a height. One level shows that height. Several levels show the span, such as 10–1500 m.
aermet_ORG.sfchas no height, so this row stays hidden.
Quick bar. Along the top of the plot: Theme, Bin size, Font, Transparency, Period, Rose type, Filter, GIS, and Animate. A change here redraws at once. Height appears only when the file has more than one level, and it starts at 10 m when that level exists, otherwise at the lowest level. Image appears only after you set a background picture, and it chooses Stretch, Contain, Center, or Tile.
Plot. The rose. The mouse wheel zooms it. View → Fit fits the drawing in the plot and centers it. View → Actual size, or Ctrl+0, returns to 100%. Ctrl+Plus and Ctrl+Minus step the zoom. The status bar shows the zoom percent. Opening a file, or changing the period, fits the result again.
Right-click the rose for Properties, Frequency table, Frequency chart, Export, Print, and Fit. That menu is there while a plot is showing.
Activity. A short log along the bottom. The newest line is at the top. It records the file you opened, exports, and resets.
Status bar. The current message, the file path, the zoom percent, and the registration line.
Opening aermet_ORG.sfc replaces the mark with the rose and fills Samples, Calm, and Average. The mark in the figure is the compass with the product name, the line “a product by Envitrans”, and “An Environmental Science & Technology Company”.